|
List
of deliverables:
This report is an
annex to the final report as it guides the reader through the
deliverables and points to tools and models that are accessible
on the web.
All reports mentioned
below are available as pdf files that can be downloaded from
the CaribCAD dissemination web site (deliverable K)
|
Deliverable
|
Description
|
Publication
form
|
|
|
Feasibility
Report
|
Report
|
|
|
Base
line implementation report
|
Report
|
|
|
Tool
development
|
Report
Tool: WFM and
Document server
|
|
|
CAD
outsourcing: Requirements Analysis and Demo Pilot 1
|
Report
Executed Pilot trail
|
|
|
Workflow
Analysis of Pilot 1
|
Report
Web enabled model
|
|
|
Requirements
Analysis Pilot 2
|
Report
|
|
|
Requirements
Analysis Benchmark
|
Report
|
|
|
Monitor
report Pilot 1 (performer side)
|
Report
Executed Pilot trail
|
|
|
Monitor
report and demo of Pilot 2
|
Report
Executed Pilot trail
|
|
|
Monitor
report and demo of Benchmark
|
Web
based Executed Pilot trail
|
|
|
CaribCAD
Web site
|
Web
site
|
|
|
Partnering
Web site;
e-commerce opportunities Report
|
Web
site (prototype)
|
|
|
Exploitation
report
|
Report
|
Below are the separate
items that deal with each deliverable; each item could be linked
to from the above table.
Deliverable
A: report
Deliverable
B: report
Deliverable
C: report
Demo of deliverable
C:
 |
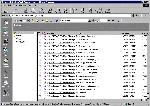
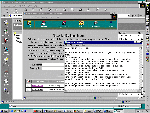
This will take
an outsource partner to his inbox of and show the message
log of recently executed flows. New unopened messages
will be in bold.
The outsource
partner can open a message, inspect the documents and
follow the trail of messages and documents.
|
 |
By
clicking on the thumbnail on the left, you can take a closer
look at the particular message. |
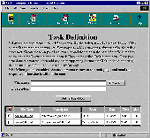
| One
can go to the definition folder of this particular message
and inspect the trail and exchange of definition documents
(in this case text exchange that are associated with the
workflow execution) |
 |
 |
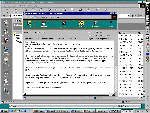
Here
is what a downloading a particular message would show. |
(------ end of Demo-----------)
Deliverable
D1/G1
Deliverable
D2:
The report explains
the WFM development process, using different stages of model
development.
Inspect the PILOT1
model here.
The model can be
extensively browsed and links to documents a decomposed tasks
can be followed.
Second stage:
development of formal WFModel in Keyflow
This requires access
through Outlook; after starting Outlook, set up for the arch50
exchange server.
The PILOT1 models
can be opened by going to the directory Templates/PILOT1.
Double clicking one
of the flows opens the flow in the Keyflow client on the local
desktop.
 |
 |
 |
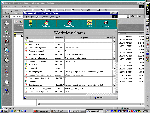
| Typical
Outlook screen |
Templates/PILOT1
Directory
|
Flow
in the Keyflow client
|
The model can now
be edited and saved back to the server.
Report D2 reports
how the three task models that constitute a generic outsourcing
process, are used in PILOT1 and in the Benchmark.
A new task can then
be started (by the project manager) with the updated model;
several pop-up windows guide the project manager through the
following choices:
- name of the new
flow
- what attachments
to include at start-up
- who the roles
in the flow will be assigned (the actual 'client' and 'performer')
 |
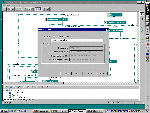
This
thumbnail shows the start-up screen of the start flow session.
|
 |
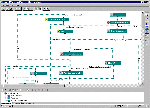
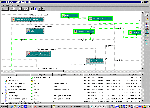
Once a flow
is started one can inspect all active or completed flows:
By selecting
one of the active flows in WFM/Active Flows one is able
to inspect the log of the flow in a graphical and text
window as shown here.
|
Deliverable
E
The report explains
the application to a B2B closed partnership workflow model.
Basically the same modeling procedure as in PILOT1 was followed
Deliverable
F
The report explains
the approach to the benchmark.
The benchmark re-uses most of the PILOT1 model. In fact Task1
and Task3 are identical; they can be inspected through Outlook/Keyflow
as explained above.
Deliverable
G2
This DC side monitor
report complements the EU side performance report (deliverable
D1/G1)
The execution trail of PILOT1 is stored and can be inspected
through a simple browser, provided one has access to the Outsource
server: http://arch50.ncl.ac.uk
A typical session for the project manager to inspect the audit
trail of a completed flow:
- log in
- inspect
the complete log of all messages and responses and added
documents
- check the
iterations and check the time it took for the tasks
to be concluded
- record the
instances where flows were manually stopped, aborted
or re-started
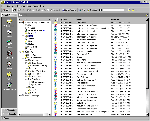
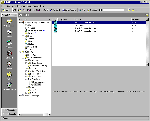
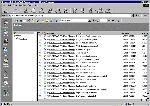
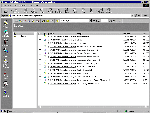
The screenshot
on the right show snapshots of a PM audit session.
|
 |
 |
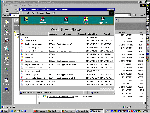
Selecting any
task and looking at the status reveals the log (through
the browser, this will only be text based):
To see the
'other' side of the flow, the PM can log in as the performer
. In this case he will see the complete log of the messages
on the client side (already shown in a screenshot on the
left for client TECAM).
|
|
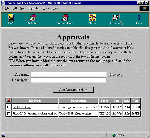
Selecting the
Approvals in above window shows the documents submitted
by performer to client:
Upon which
these documents can be downloaded for inspection by the
PM.
|
 |
Deliverable
H
Shows basically the
same approach but different models as in PILOT1.
Deliverable
I
 |
Basically the
same approach as in PILOT1. This was a useful benchmark
to test the applicability of the generic parts of PILOT1
(CAD) in a very different domain (GIS).
Client (PUCMM) and performer (DK), chose to not engage
in a performance test as they assumed a trusted relationship
with proven expertise.
The first screenshot
on the left shows the performer side.
Again document
trails can be inspected and relevant documents and communication
trails can be evaluated to help improve future outsource
projects.
|
 |
Deliverable
J: Final Report
Deliverable
K: http://www.funredes.org/caribcad
Deliverable
L: http://www.funredes.org/caribcad/outsourcing/
Supporting documents:
|
